Quarterly Key Data Report Q4 2025
1. Background
ComReg collects statistical data from authorised operators on a quarterly basis. Not all such operators are included in this data collection (based on minimum revenue levels), but ComReg aims to represent 95% of the total markets. This data includes information on subscriptions, lines, revenues, broadband speeds, minutes and data usage for both fixed and mobile voice and broadband. The data and charts included below are a subset of the information collected. The detailed presentations of data are available on the ComReg data portal.
Map visualisations for ‘FTTP’ and ‘Gigabit’ Coverage and Take-Up statistics by County, Local Electoral Area, Electoral Division and other Geographic units can be found at ComReg’s Open Data Map Hub.
Data presented in this Summary of the Quarterly Key Data is based on questionnaires completed by certain authorised operators for the period from 1st October 2025 to 31st December 2025. The report is based on submissions from 55 active operators.
Q4 2025 Infographic

Fibre to the Premises (FTTP)
84% of premises have FTTP broadband available.
59% of active broadband lines are FTTP broadband.
Broadband Speeds
- 71% of active broadband lines have speeds 500 Mbps or greater.
- 24% have speeds of 1 Gbps or greater.
Gigabit Broadband Coverage
90% of premises in Ireland have Gigabit broadband available.
Mobile Statistics
78% of mobile subscribers are on bill pay.
2.83 million 5G mobile, broadband, and machine-to-machine subscribers.
Average Monthly Mobile Usage
- 150 minutes per user
- 32 SMS texts per user
- 21 GB of data per user
2. Overview of Irish Communications Market Q4 2025
Table 1 – Communications Summary
| Summary | 2025 Q1 | 2025 Q2 | 2025 Q3 | 2025 Q4 |
|---|---|---|---|---|
| Total Retail Market Revenues (000s) | €906,255 | €921,811 | €922,885 | €949,743 |
| Total Fixed Line Wholesale Revenues (000's) | €150,117 | €151,734 | €155,233 | €161,204 |
| Total Mobile Wholesale revenues (000's) | €29,631 | €30,108 | €32,294 | €31,352 |
| Percentage Premises with FTTP Broadband Available | 75.7% | 78.5% | 81.0% | 84.3% |
| Percentage Premises with Gigabit Broadband (FTTP or Cable) Available | 86.0% | 87.7% | 88.9% | 90.0% |
| FTTP Take Up Rate | 49.6% | 50.2% | 50.6% | 50.7% |
| FTTP & Cable Take Up Rate | 57.9% | 58.4% | 58.9% | 59.7% |
| Total Fixed Broadband Subscriber Lines | 1,703,577 | 1,716,609 | 1,757,461 | 1,765,075 |
| Total Fixed Voice (PSTN, ISDN and VOIP) Subscriber Lines | 1,051,412 | 1,032,148 | 1,009,554 | 995,826 |
| Mobile Subscriptions inc. MBB and M2M - Total | 10,418,806 | 10,561,301 | 10,732,236 | 10,844,594 |
| Machine to Machine (M2M) Subscriptions | 4,073,487 | 4,179,852 | 4,276,911 | 4,367,068 |
| Mobile Broadband (MBB) Subscriptions | 393,913 | 393,253 | 394,084 | 393,979 |
| Mobile Subscriptions exc. MBB and M2M - Total | 5,951,406 | 5,988,196 | 6,061,241 | 6,083,547 |
| Total Voice Traffic Minutes (000s) | 3,007,905 | 2,943,592 | 2,931,126 | 2,950,700 |
| Total Fixed Voice Minutes (000s) | 228,294 | 215,252 | 212,185 | 206,315 |
| Total Mobile Voice Minutes (000s) | 2,779,611 | 2,728,340 | 2,718,942 | 2,744,385 |
Fixed Market
- In Q4 2025, Eir had the highest revenue share (retail and wholesale) in the fixed market at 36.5%.
- ComReg estimates that the next nine largest operators (Virgin Media Ireland, Vodafone (fixed only), Sky Ireland, ECL (formerly BT Ireland), SIRO, E-Net, National Broadband Ireland, Digiweb and Tetra) contribute a further 48.2% share of total industry revenue.
- Remaining other authorised operators (OAOs) account for the residual 15.3% share.
Figure 1 – Fixed Line Market Shares (Wholesale and Retail Revenue) Q4 2024 – Q4 2025 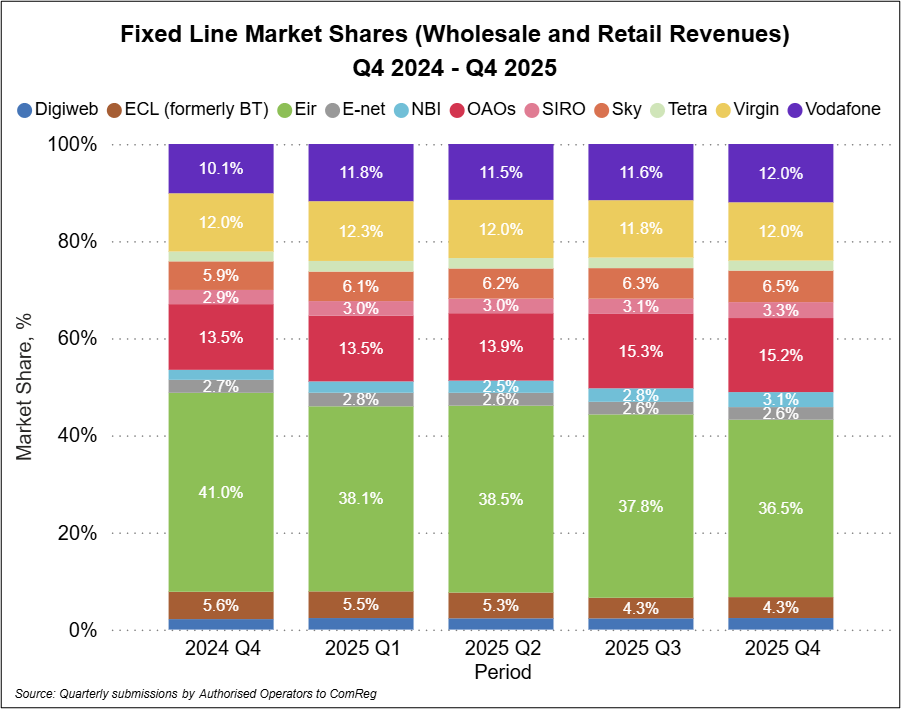
Retail Fixed Voice Market
- Fixed voice traffic in Q4 2025 was approximately 206 million minutes, which was a 2.63% decrease on Q3 2025 and a decrease of 8.5% since Q4 2024.
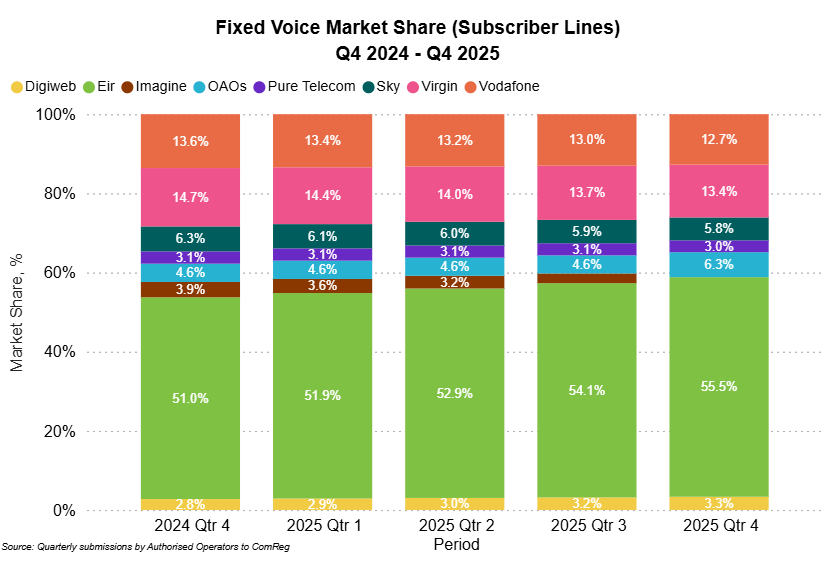
- At the end of Q4 2025, there were 995,826 fixed voice subscriber lines, a decrease of 1.4% since Q3 2025 and a decrease of 7.6% since Q4 2024.
- As of Q4 2025, Eir had 55.5% of all fixed voice subscriber lines followed by Virgin Media (13.4%), Vodafone (12.7%), Sky Ireland (5.8%), Pure Telecom (3.0%) and Digiweb (3.3%). Other operators accounted for the remaining 6.3% of fixed voice subscriber lines.
Figure 2 – Retail Fixed Voice Subscriber Lines
3. Retail Broadband Market
- At the end of December 2025, there were over 2.16 million active total Broadband subscriber lines in Ireland.
- This is a 0.3% increase from the previous quarter and a 3.3% increase on Q4 2024.
- Looking at total Fixed Broadband lines only, these increased by 0.4% since Q3 2025, with a 3.0% annual increase on Q4 2024.
Table 2 – Total Number of Active Broadband Subscriber Lines
| Line Type | Q4 2025 | Quarterly Change Q3'25 - Q4'25 | Annual Change Q4'24 - Q4'25 |
|---|---|---|---|
| Cable Broadband | 284,079 | -2.91% | -10.80% |
| DSL Broadband | 42,827 | -7.10% | -31.36% |
| VDSL Broadband | 280,666 | -5.82% | -20.94% |
| FTTP Broadband | 1,050,123 | 4.55% | 21.11% |
| Satellite Broadband | 25,573 | -4.94% | 78.74% |
| FWA Broadband | 81,807 | -8.56% | 1.92% |
| Total Fixed Broadband | 1,765,075 | 0.43% | 3.98% |
| Mobile Broadband | 393,979 | -0.03% | 0.69% |
| Total Broadband | 2,159,054 | 0.35% | 3.37% |
- FTTP (+4.5%) broadband subscriber lines showed positive growth this quarter.
- VDSL (-5.8%), DSL (-7.1%), Cable (-2.9%), Satellite (-4.9%), FWA (-8.5%) and Mobile Broadband (-0.03%) subscriber lines fell this quarter.
Figure 3 – Retail Fixed Broadband Market Shares based on Subscriber Lines
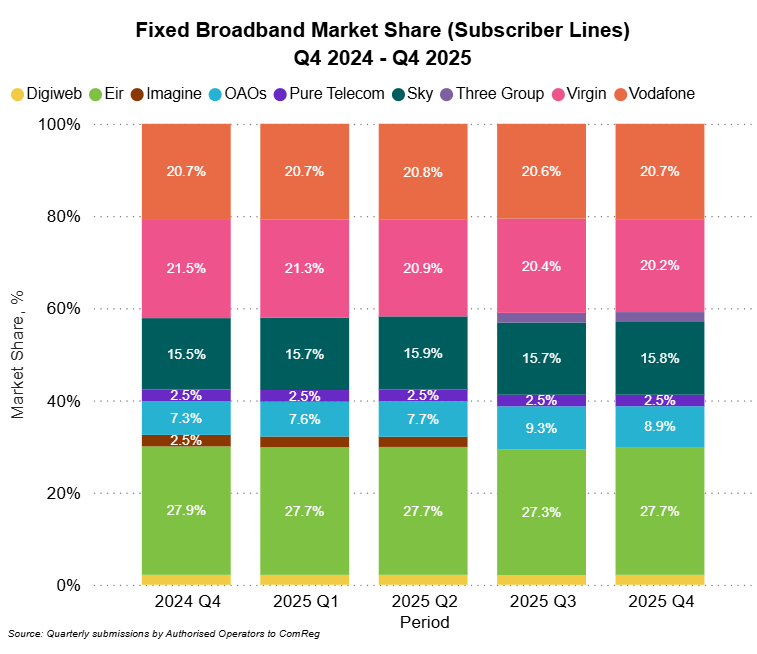
- In Q4 2025, Eir had 27.7% of total retail fixed broadband subscriber lines, followed by Vodafone at 20.7%, Virgin Media at 20.2%, Sky Ireland at 15.8%, Pure Telecom at 2.5%, Digiweb at 2.2% and Three Group at 2.1%
- All other authorised operators (OAOs) combined accounted for the remaining 8.9% share of retail fixed broadband subscriber lines.
Table 3 – Retail Fixed Broadband Subscriber Lines by Sold Download Speed
| Fixed Broadband Subscriber Lines by Sold Speed | Q3 2025 | Q4 2025 | Quarterly Change |
|---|---|---|---|
| <2Mbps - 9.99Mbps | 1.76% | 1.62% | -0.13% |
| 10Mbps - 29.99Mbps | 2.72% | 2.54% | -0.17% |
| 30Mbps - 99.99Mbps | 16.96% | 15.94% | -1.02% |
| 100Mbps - 499.99Mbps | 9.43% | 9.19% | -0.24% |
| 500Mbps - 999.99Mbps | 46.86% | 46.83% | -0.04% |
| >=1GB - 1.99GB | 21.22% | 22.56% | 1.33% |
| >=2GB - 4.99GB | 0.50% | 0.55% | 0.05% |
| >=5GB - 10GB | 0.55% | 0.78% | 0.23% |
- In Q4 2025, 79.9% of all fixed broadband subscriber lines had sold download speeds which were equal to or greater than 100Mbps, with 70.7% having sold download speeds equal to or greater than 500Mbps.
- Those having sold download speeds equal to or greater than 1GB increased by 1.6 percentage point quarter on quarter and stood at 23.9%.
Figure 4 – FTTP Subscriber Line Market Share
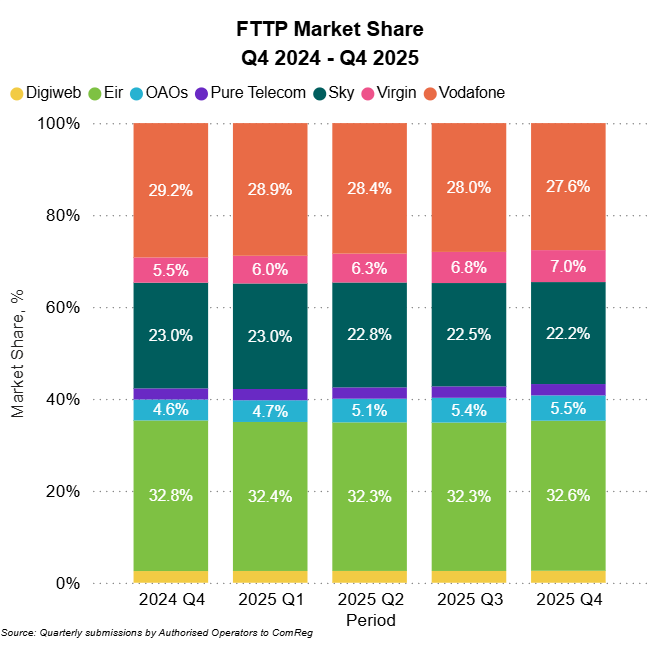
- In Q4 2025, Eir had 32.6% of retail Fibre to the Premises (FTTP) subscriber lines, followed by Vodafone at 27.6%, Sky Ireland at 22.2%, Virgin Media at 7.0%, Digiweb at 2.6% and Pure Telecom at 2.5%.
- Other operators accounted for the remaining 5.5%.
4. Broadband Market – Networks
Figure 5 – Network FTTP Active Subscriber Lines by Quarter
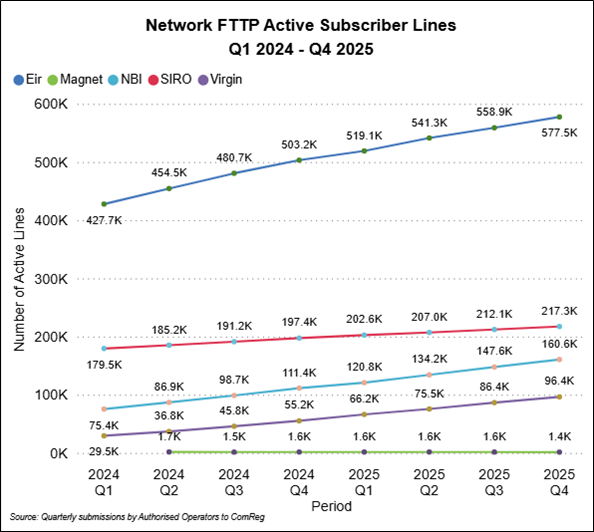
- In Q4 2025, based on the underlying network, 577k (up 3% QoQ) of the active FTTP subscriber lines were sold on the Eir network.
- 217k (up 2% QoQ) were on the Siro network.
- 160k (up 9% QoQ) were on the NBI network.
- 96k (up 11% QoQ) were on the Virgin Media network.
- 1.4k were on the Magnet Network (Magnet began reporting Network FTTP lines in Q2 2024, the number of lines at the end of Q2 would be broadly similar to the lines present in the previous years.)
Figure 6 – Network FTTP Broadband Rollout (No. of Lines) by Quarter
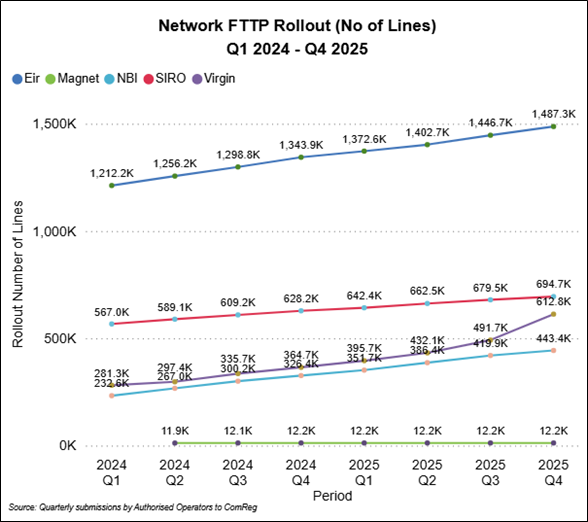
In Q4 2025, Eir reported having rolled out 1.48m (up 3% QoQ) FTTP broadband lines , followed by Siro with 694k (up 2% QoQ), Virgin Media Ireland with 612k (up 25% QoQ), NBI with 443k (up 6% QoQ), with Magnet having rolled out 12k lines and Crossan 63 lines.
Total Gigabit (FTTP and Cable) Coverage
-
- Map visualisations for Gigabit Coverage and Take-Up statistics by County, Local Electoral Area, Electoral Division and other geographic units can be found at ComReg’s Open Data Map Hub
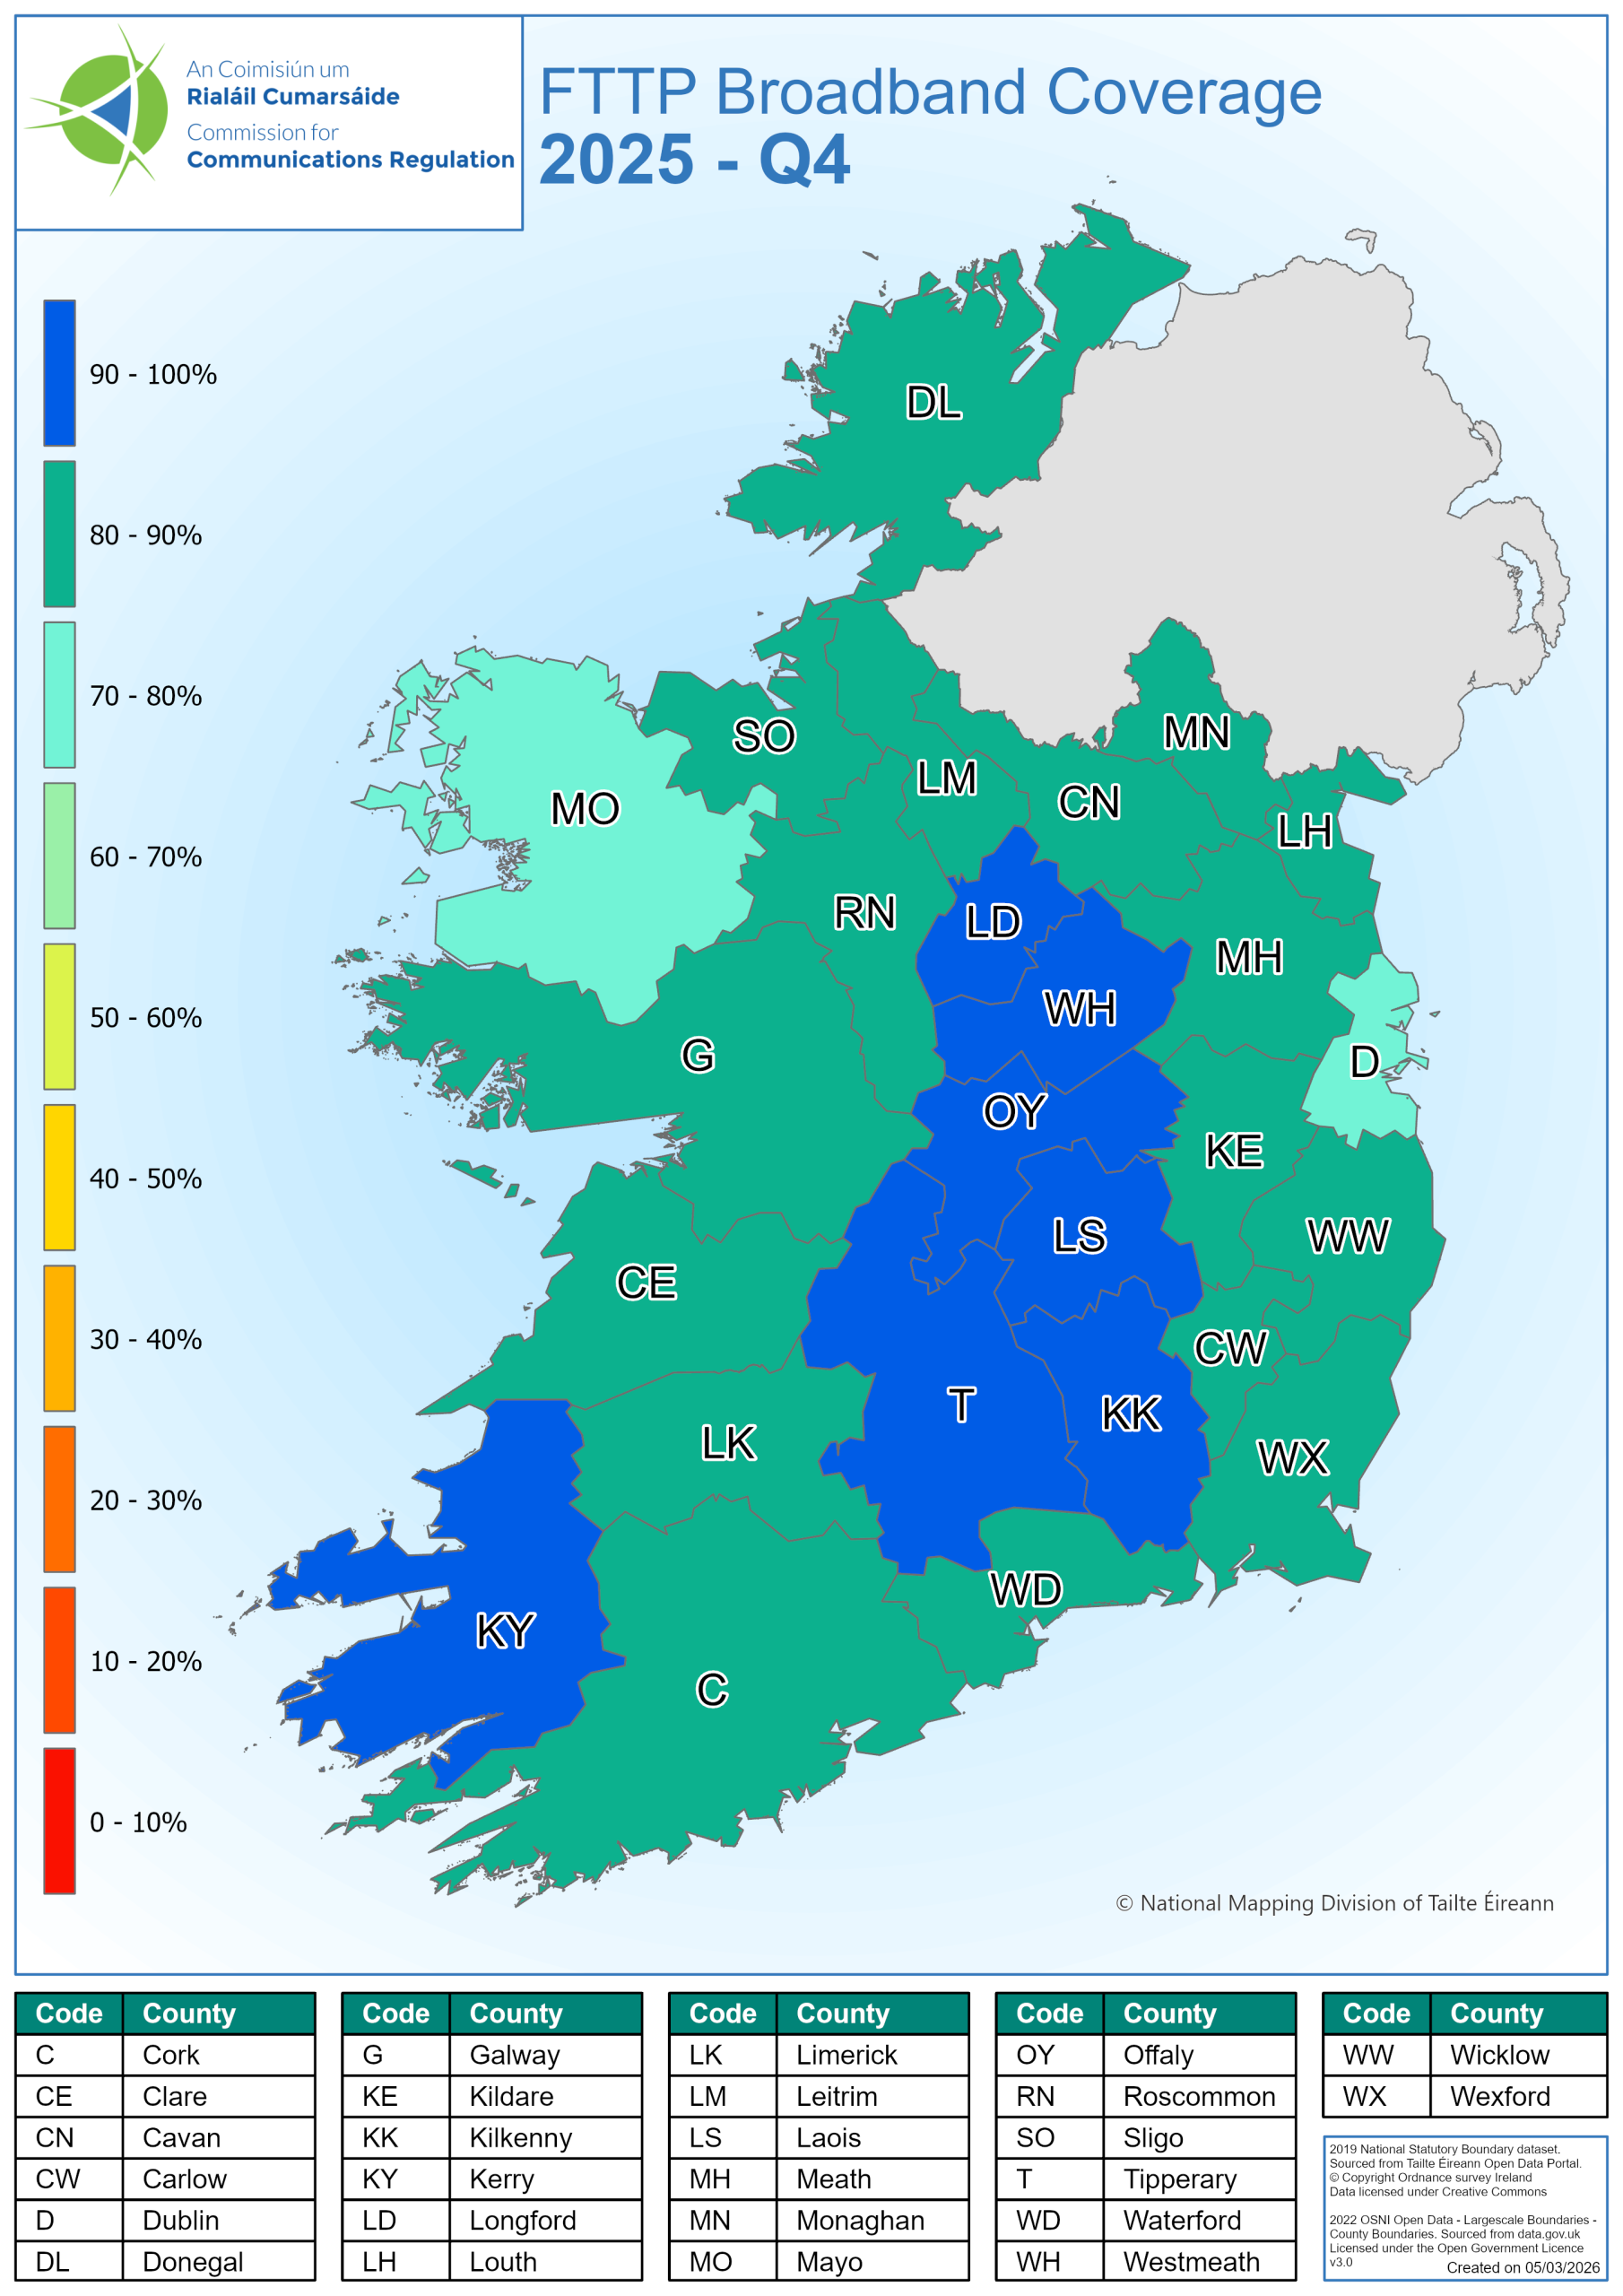
- 84% (up 3.3 percentage points QoQ) of all premises (as measured by Eircodes) in Ireland had FTTP broadband available at the end of Q4 2025.
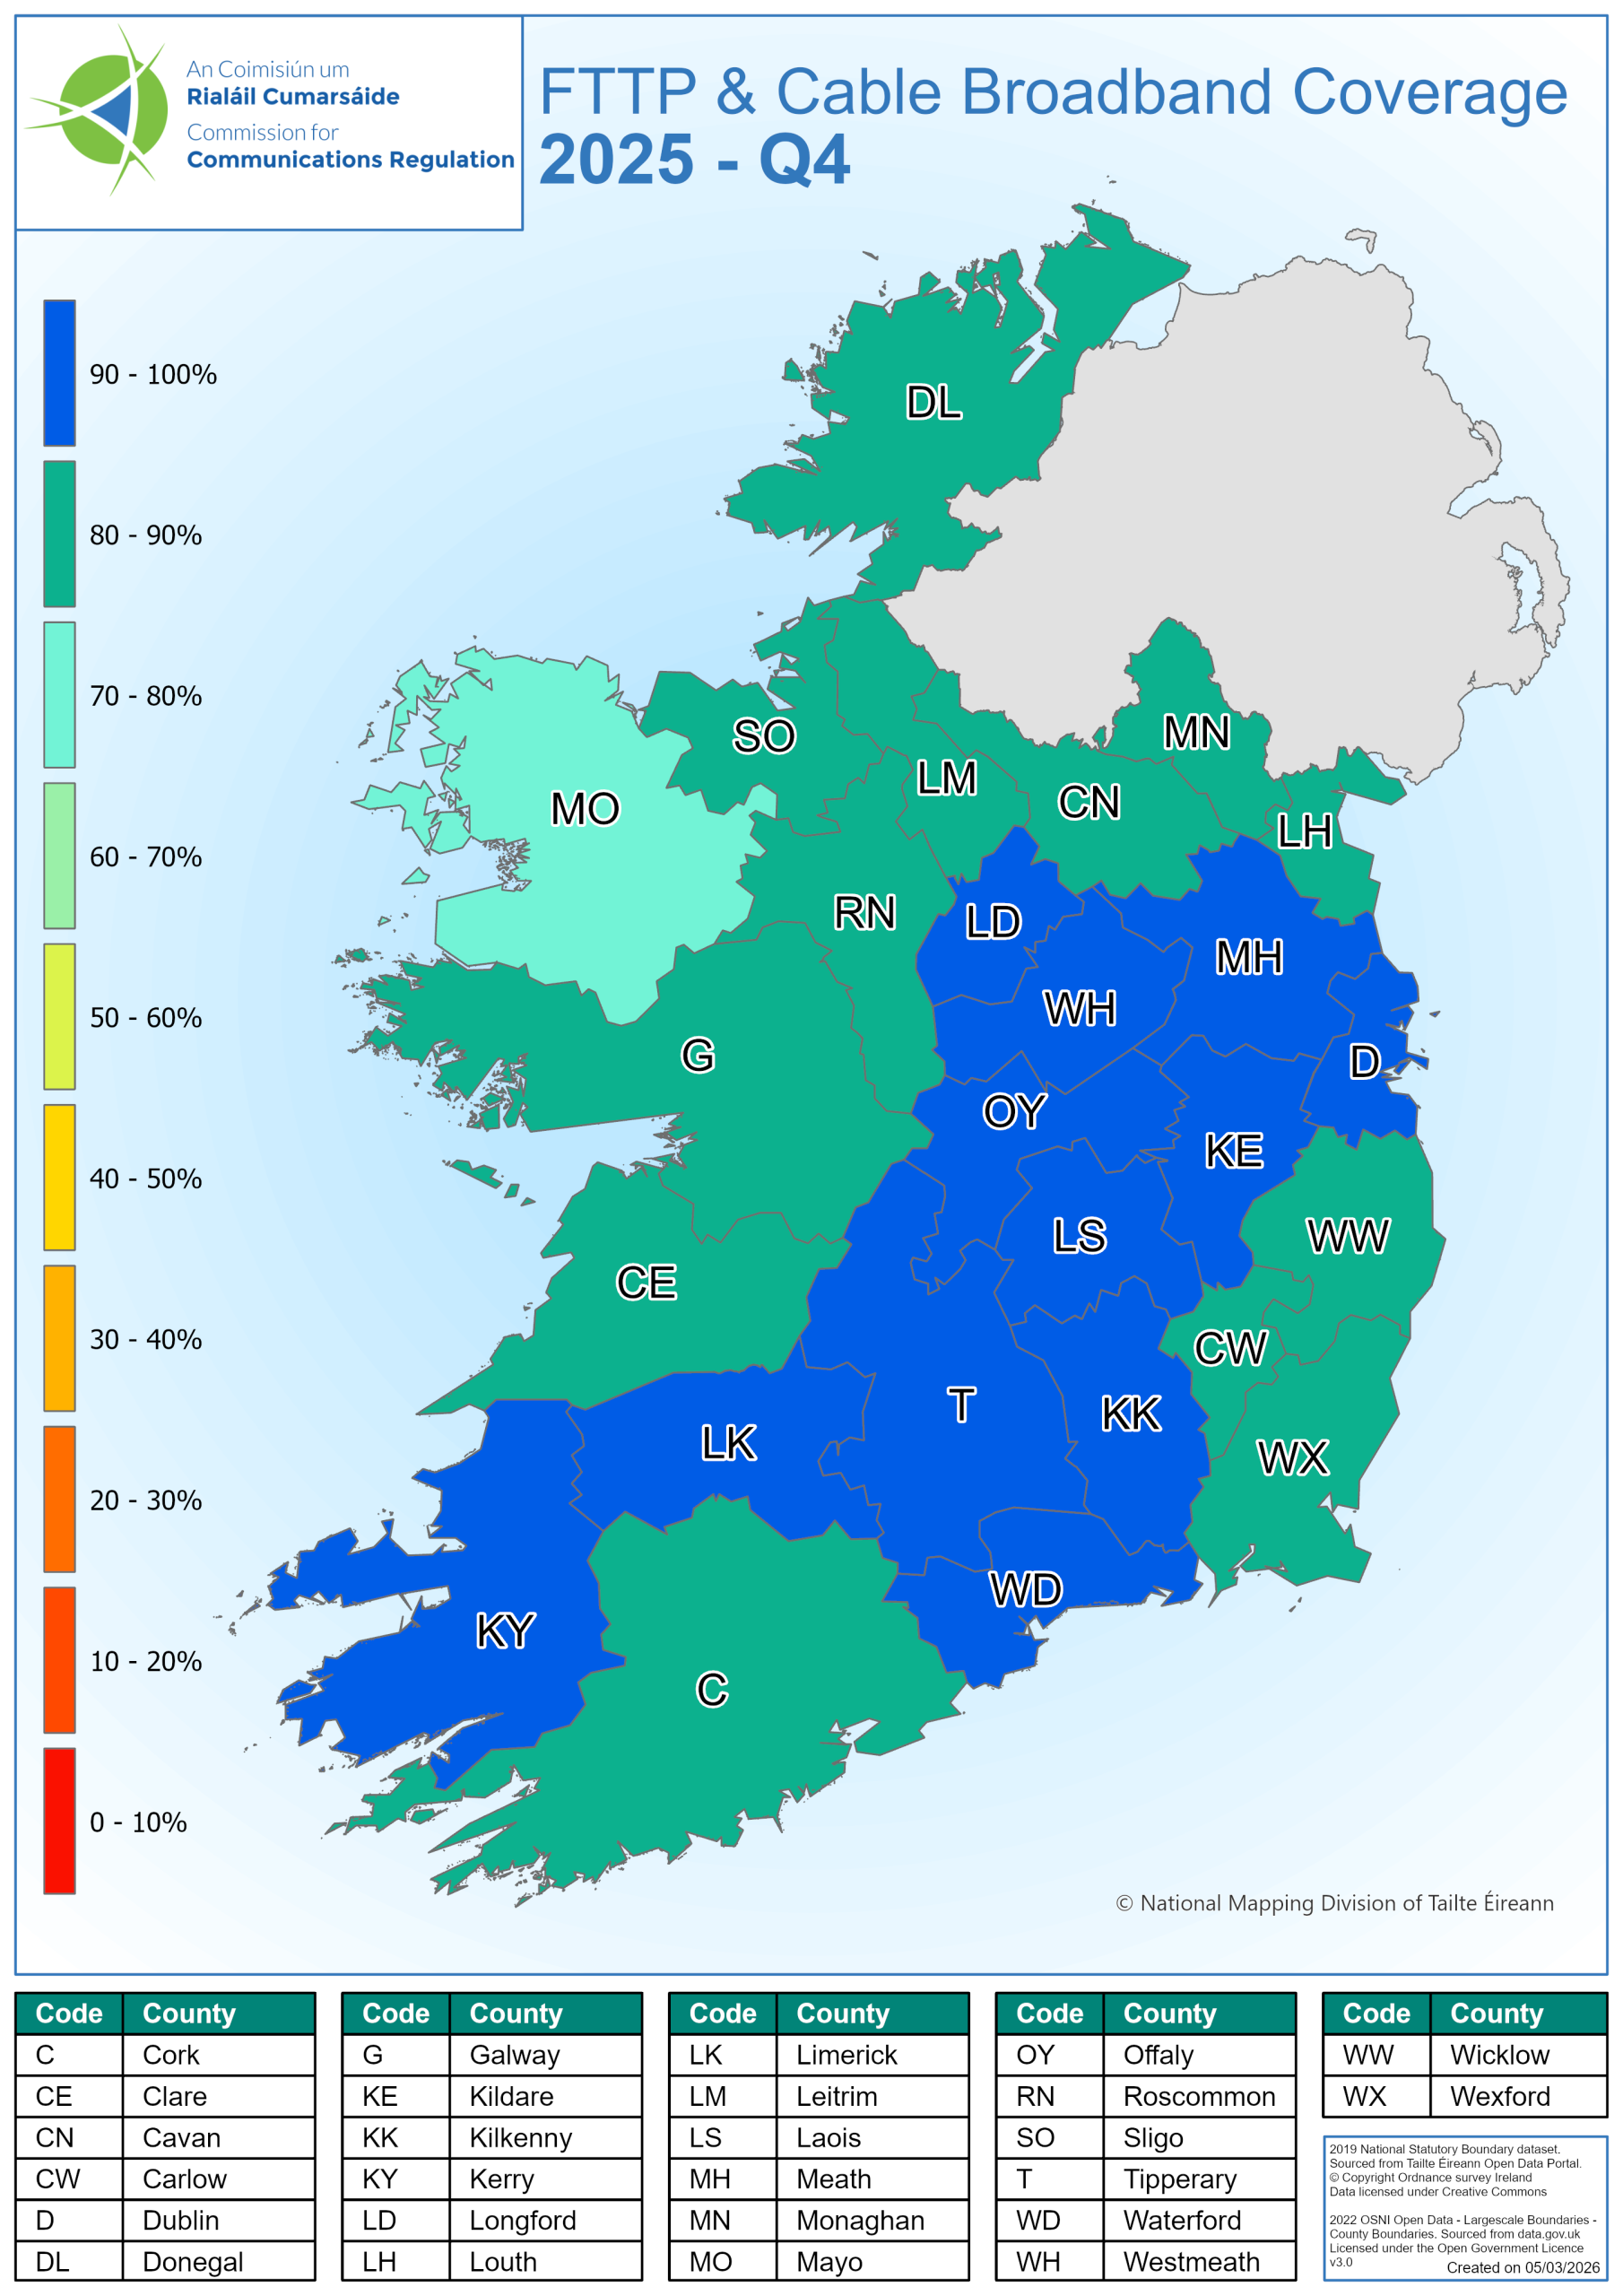
- 90% (up 1.1 percentage points QoQ) of all premises (as measured by Eircodes) in Ireland had Gigabit broadband available at the end of Q4 2025.
- The county with the highest level of FTTP coverage is Westmeath at 95%. Westmeath also has the highest level of Gigabit coverage at 96%. Every county had a minimum of 75% FTTP coverage at the end of Q4.
- Dublin has the fastest growing FTTP coverage within the last year, with a 19-percentage point annual increase in FTTP coverage to now stand at 77% coverage.
- Dublin shows the highest quarter‑on‑quarter increase in FTTP coverage, rising by 7-percentage points compared with the previous quarter.
- ComReg’s Open Data Map Hub includes additional geographic units including Local Electoral Area, Electoral Division and Small Area.
Total Gigabit (FTTP and Cable) Coverage
-
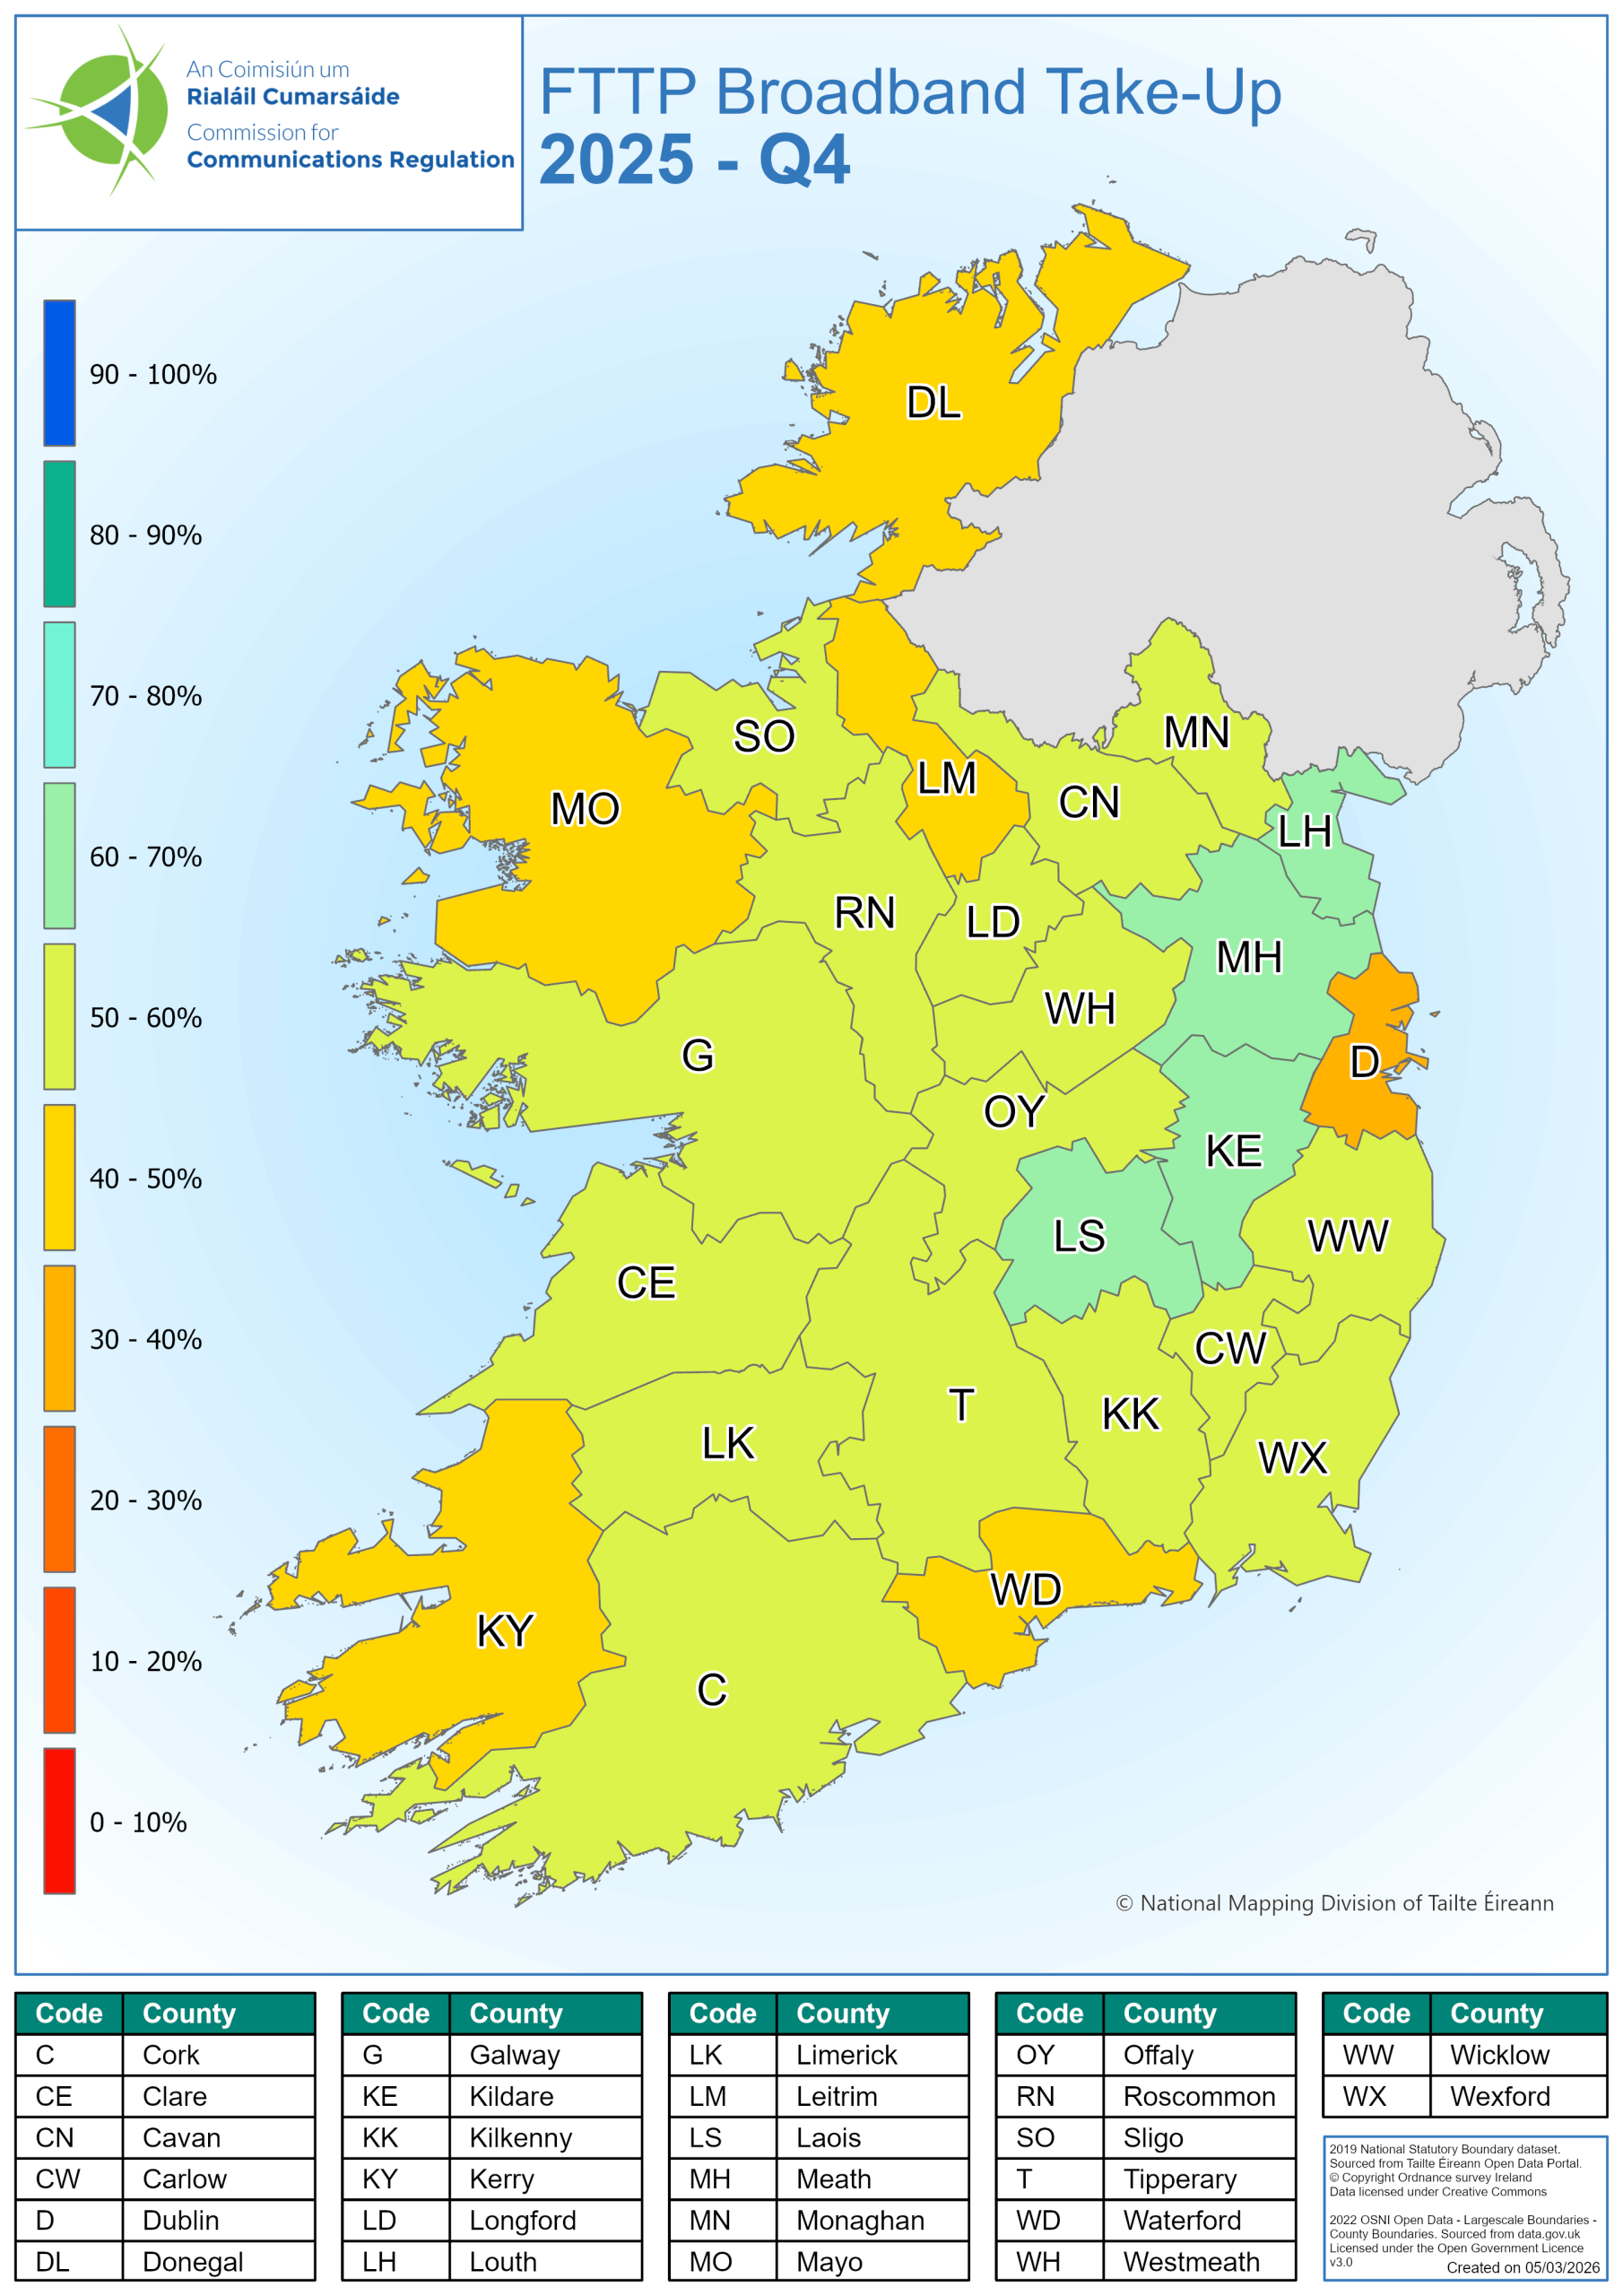
- In terms of FTTP take-up (active FTTP broadband premises divided by premises where FTTP is available), 50.7% of all premises (up 2 percentage points YoY) with FTTP broadband available had an active FTTP service at the end of Q4 2025.
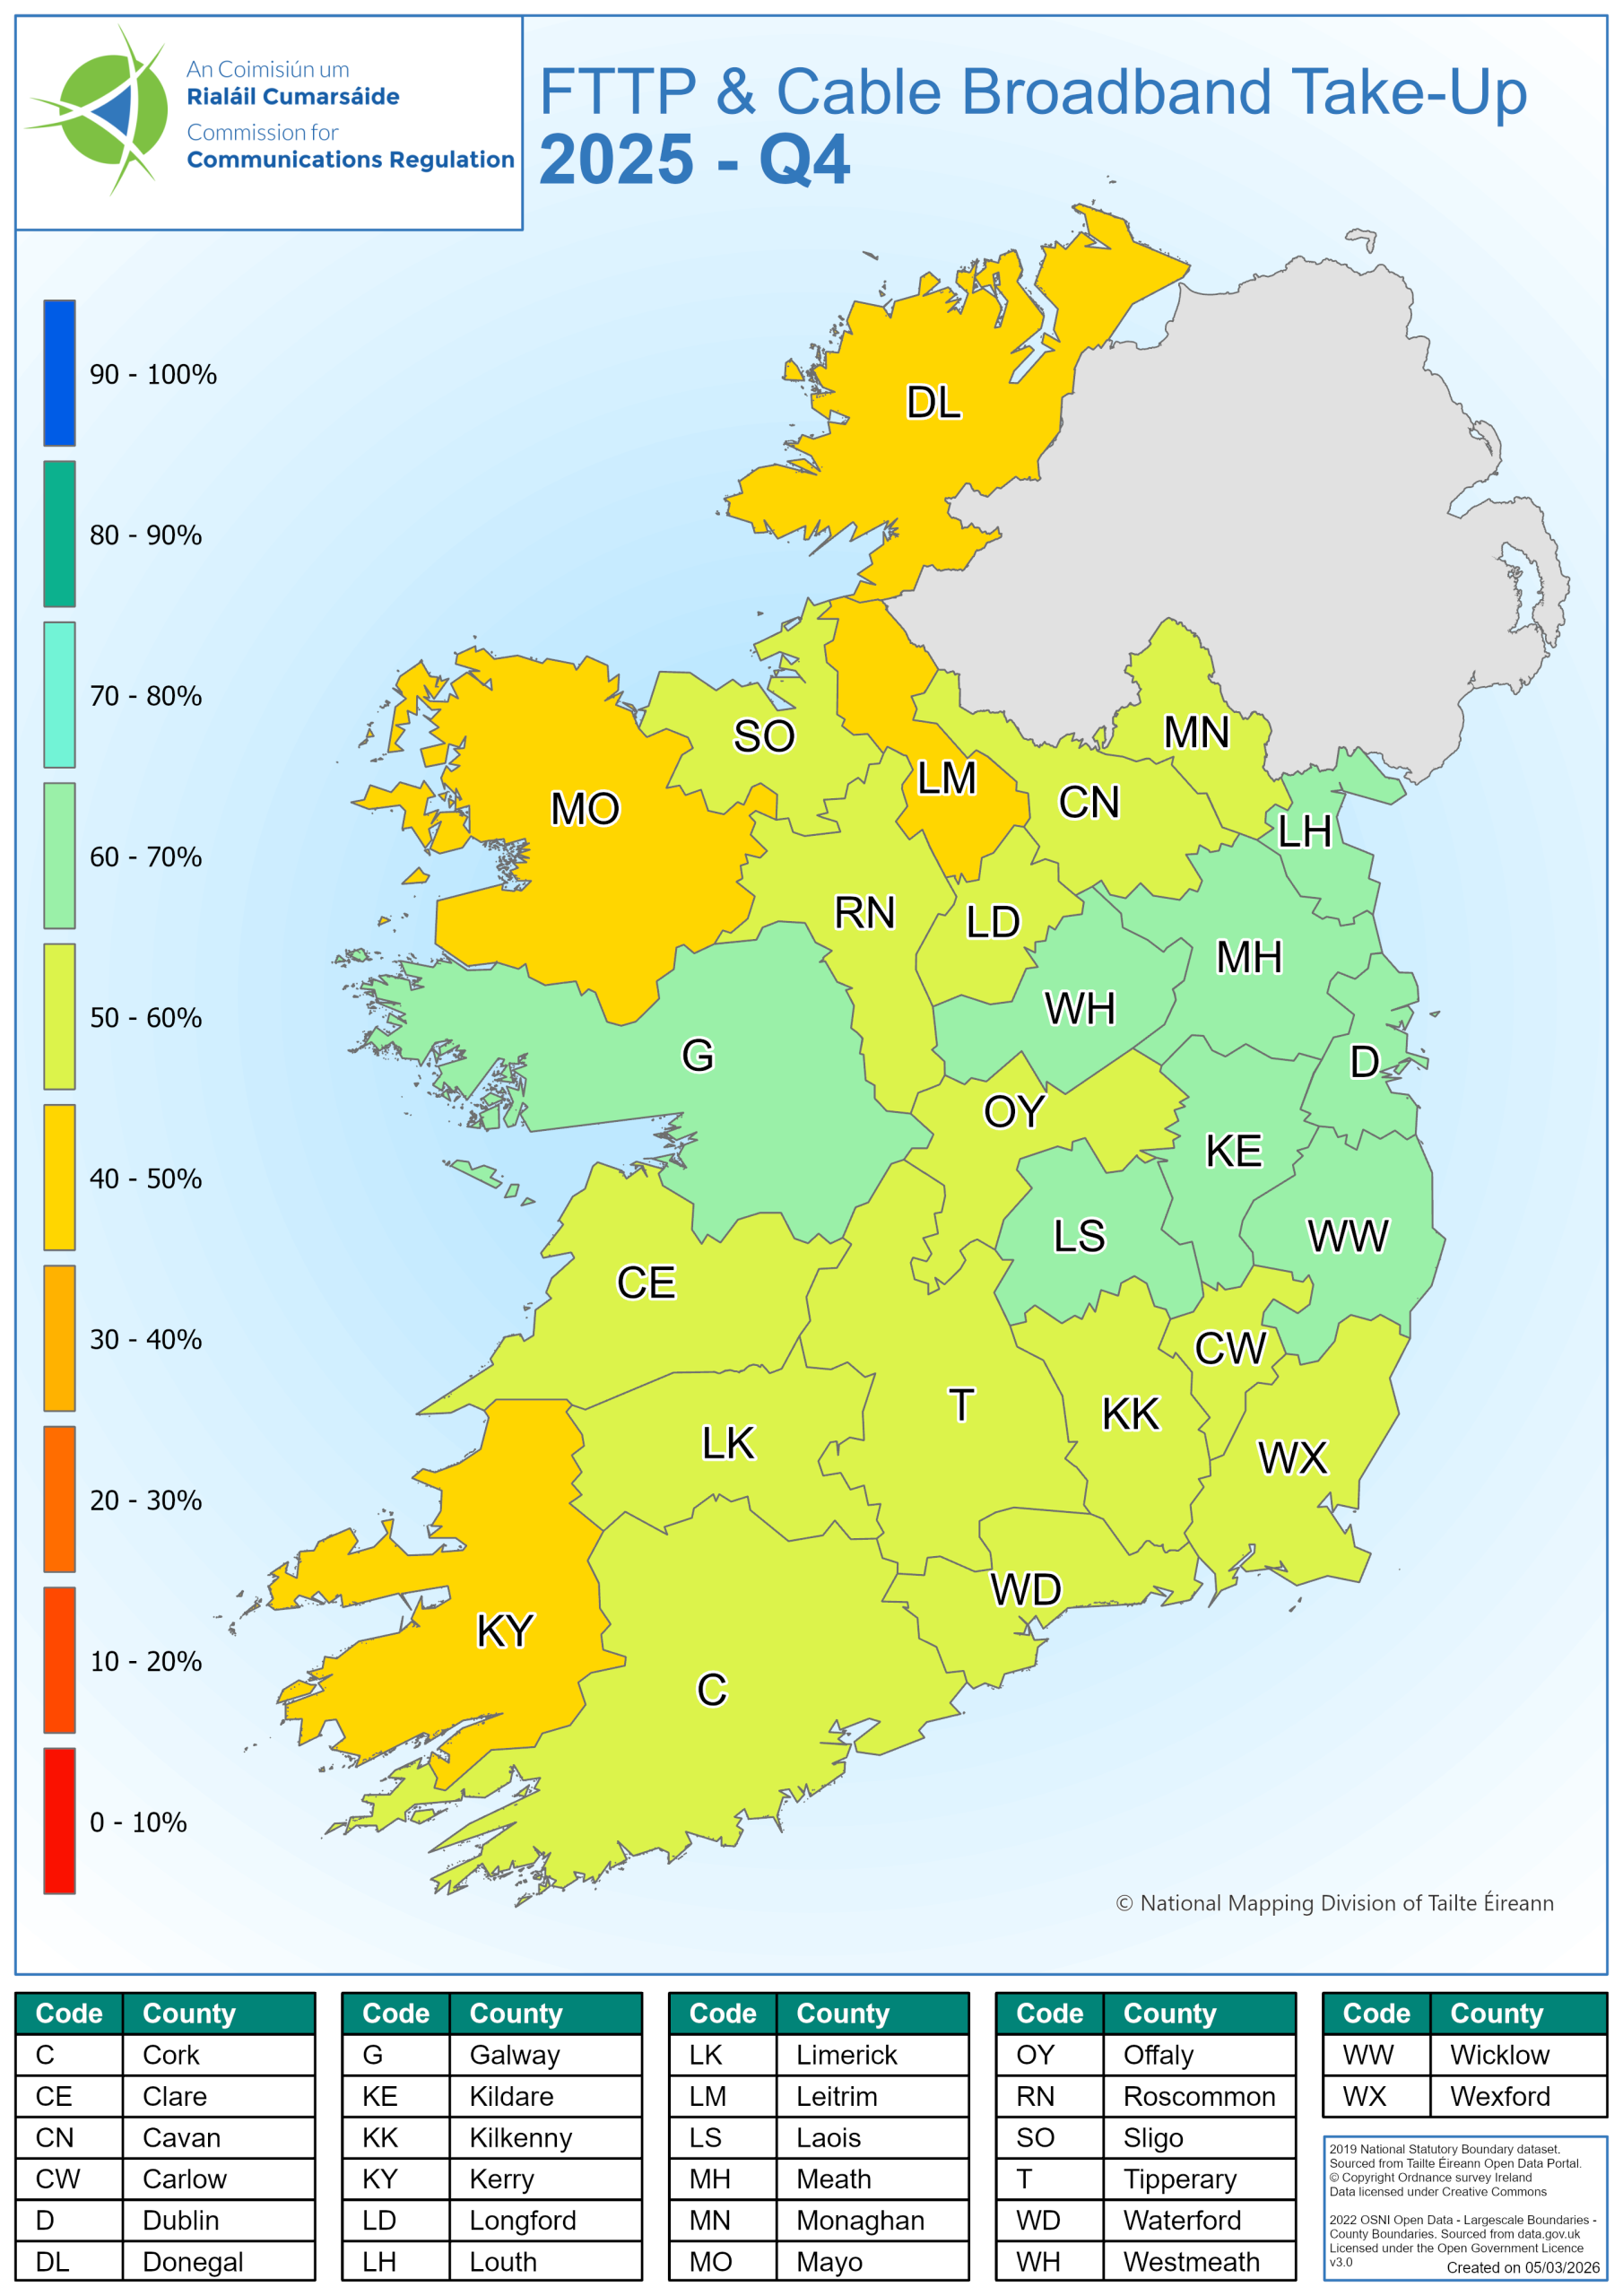
- 59.7% of premises with FTTP or Cable available had an active FTTP or Cable service at the end of Q4 2025.
- The maps set out below show County level ‘FTTP’ and ‘Gigabit’ take-up rate by County for Q4 2025.
- The county with the highest level of FTTP take-up is Meath at 64%. Longford had the fastest growing FTTP take-up rate within the last year, with a 7.3-percentage point increase in take-up compared to Q4 2024.
- See ComReg’s Open Data Map Hub for further map visualisations on Gigabit broadband. For example, 93% of premises in the Electoral Area of Newport in Co. Tipperary had Gigabit broadband available at the end of Q4 2025.
5. Mobile Market
At the end of Q4 2025 there were 10,844,594 mobile subscriptions in Ireland, including mobile broadband (MBB) and Machine to Machine (M2M). If mobile broadband subscriptions (393,979) and M2M subscriptions (4,367,068) are excluded, the total number of mobile voice subscriptions was 6,083,547
Figure 7 – Market Shares by Subscription including Mobile Broadband and Machine to Machine
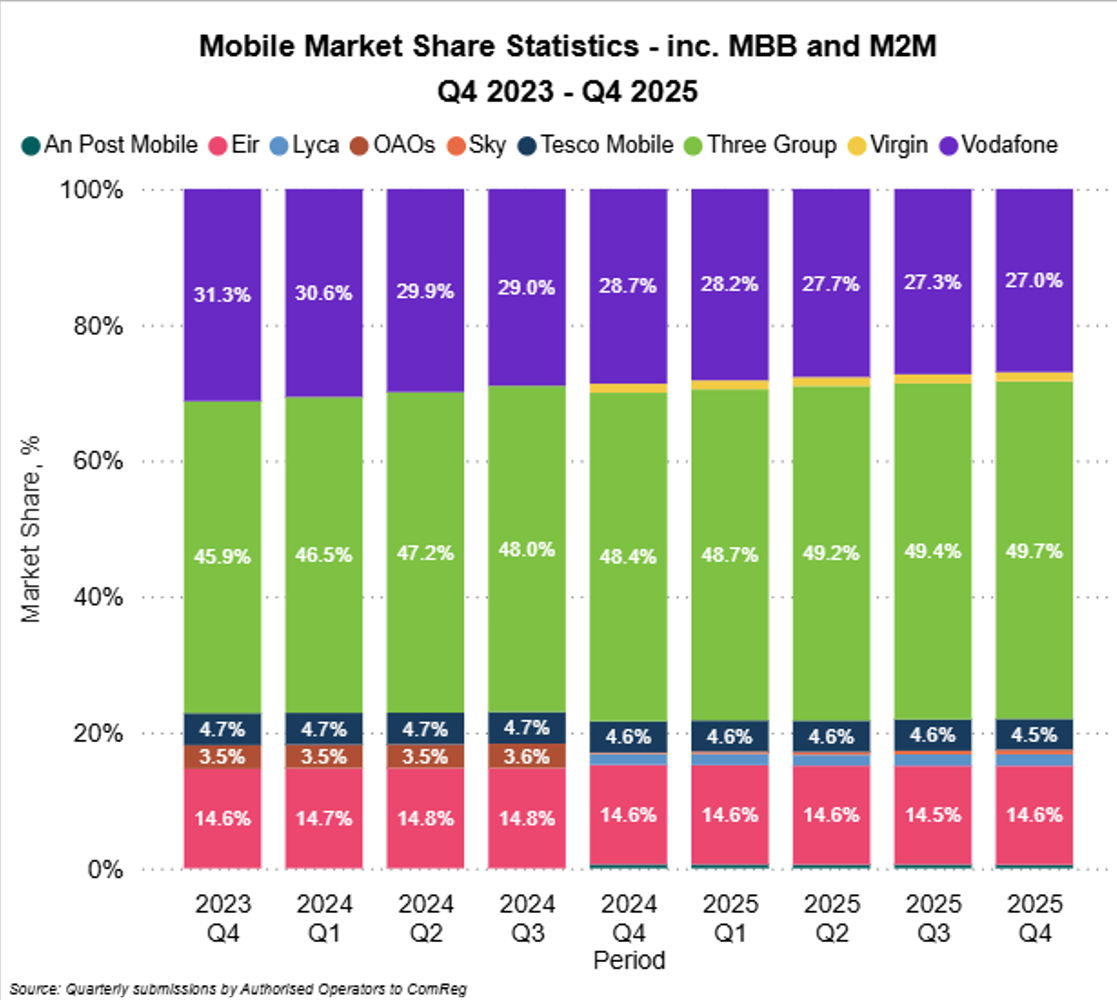
In Q4 2025 Three had the largest share of mobile subscriptions including MBB and M2M at 49.7%. This was followed by Vodafone with 27.0%, Eir with 14.6%, Tesco Mobile at 4.5%, Lyca Mobile at 1.7%, Virgin Mobile at 1.3%, Sky Mobile at 0.7% and An Post Mobile at 0.5%.
Figure 8 – Market Shares by Subscription excluding Mobile Broadband and Machine to Machine
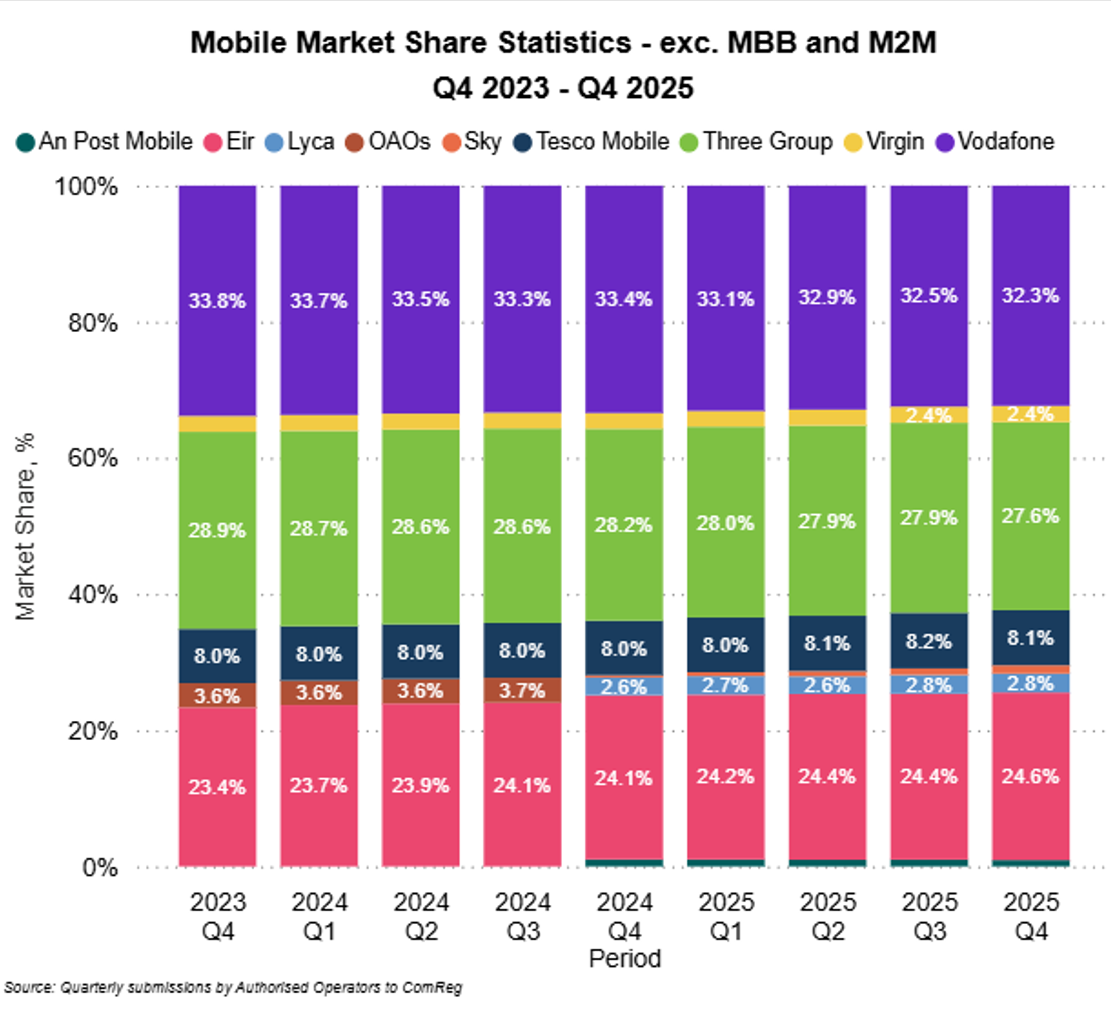
In Q4 2025 Vodafone had the highest market share excluding mobile broadband and M2M (32.3%), followed by Three (27.6%), Eir (24.6%), Tesco Mobile (8.1%), Lyca (2.8%), Virgin Mobile (2.4%), Sky Mobile (1.2%) and An Post Mobile (0.9%).
Figure 9 – Mobile Subscriptions by Technology
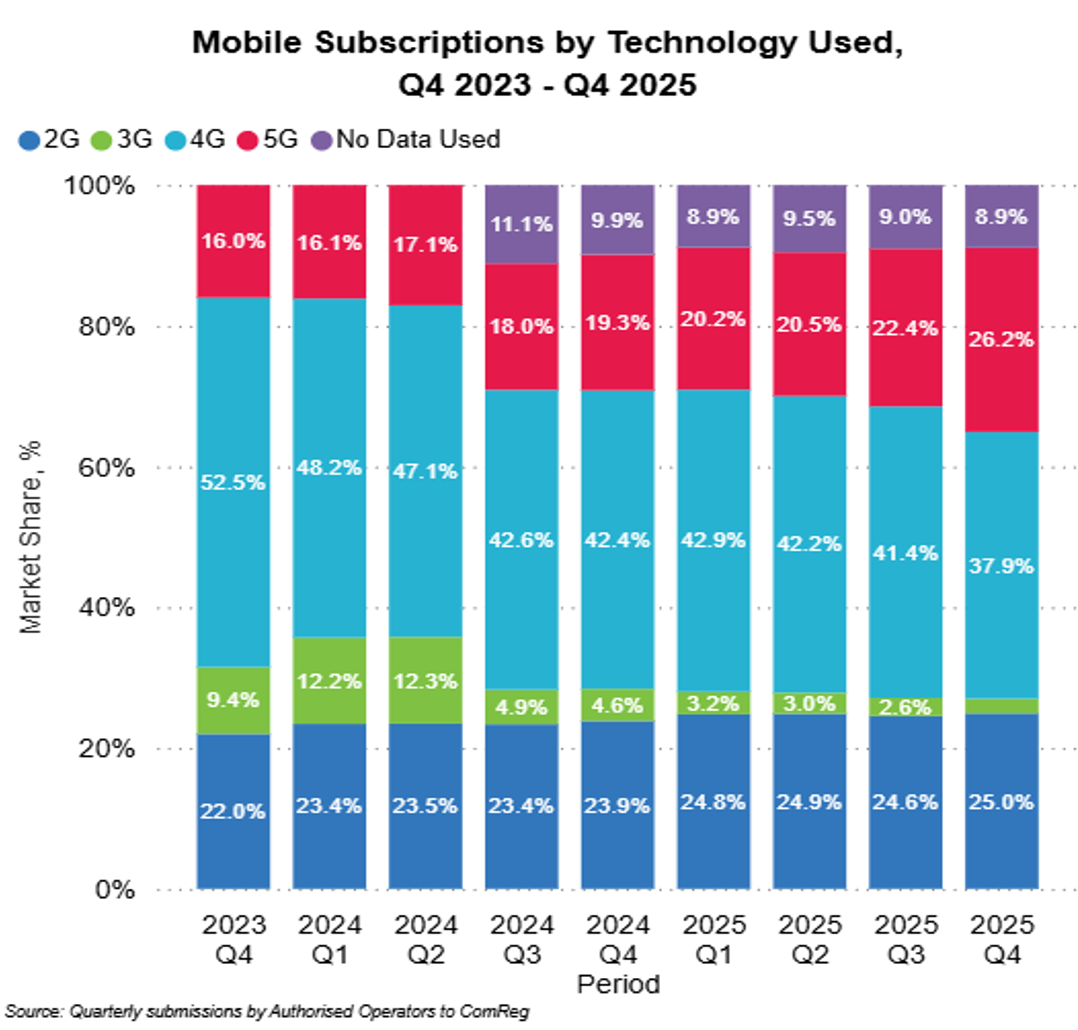
There were 2,705,926 2G (24.95%), 222,754 3G (2.05%), 4,112,896 4G (37.93%) and 2,837,624 5G (26.17%) mobile subscriptions in Q4 2025. 965,394 (8.9%) mobile subscriptions did not record any use of data in Q4 2025.
6. Revisions
Note 1: ECL (formerly BT) revised wholesale revenue for Q3 2025.
Note 2: BTBTIL revised PSTN/ISDN minutes for Q3 2025.
Note 3: eNet revised broadband copper revenues for Q3 2025.
Note 4: Magnet+ revised PSTN/ISDN minutes for Q3 2025.
Note 5: IFA Telecom revised PSTN revenues for Q3 2025.
Note 6: Three revised ARPU figures for Q2 and Q3 2025.
Note 7: Three revised VOIP revenues for Q3 2025.
Note 8: AT&T revised call origination figures for Q3 2025.
7. Appendix 1: Legal Disclaimer
The information and statistics contained within this document are derived from a variety of sources, but it is mostly reliant on data obtained from authorised operators.
This document does not constitute commercial or other advice. No warranty, representation or undertaking of any kind, express or implied, is given in relation to the information and statistics contained within this document.
To the fullest extent permitted by law, neither the Commission for Communications Regulation (“ComReg”) nor any of its employees, servants or agents will be liable for any loss or damage arising out of or in connection with your use of, or any reliance whatsoever placed on this document (including, but not limited to, indirect or consequential loss or damages, loss of income, profit or opportunity, loss of or damage to property and claims of third parties) even if ComReg has been advised of the possibility of such loss or damages or such loss or damages were reasonably foreseeable.